发烧论坛

注册


发新话题 回复该主题

Loudspeakers: Measurements如何测试喇叭... [复制链接]

1#

Rene St. Denis sets up a loudspeaker in the NRC's Anechoic Chamber. All speakers are measured in the same chamber with identical equipment to ensure consistent and comparable results.

Our loudspeaker measurements are performed by the prestigious National Research Council of Canada. The NRC’s facilities include a modern anechoic chamber and precision measuring devices, along with staff with decades of experience conducting these tests. All measurements are performed separate from the subjective evaluation -- the body of the review.
In all, we perform a total of eight tests displayed on five charts to give perspective into the measured performance of the loudspeakers under evaluation.
Measurement distance
All small- and medium-sized loudspeakers are measured at a distance of 2 meters (6.5 feet). Where appropriate, larger loudspeakers are measured from a distance of 3 meters (9.75 feet) to allow for proper driver integration.

Chart 1 - Frequency Response and Sensitivity

Four measurements can be seen on this chart:
  • On-axis frequency response - Measured directly in front of the speaker face (2 or 3 meters).

    Purpose: Shows the forward-firing output of the loudspeaker across the audible frequency spectrum.

    What it tells you: In comparison to the 15 degree and 30 degree measurements we do, this measurement should be the flattest and have the widest bandwidth. Bandwidth refers to the upper (highs) and lower (bass) frequencies that the loudspeaker under test will reproduce. Most good speakers today will extend easily to 20kHz and beyond, although bass performance will vary widely. Full-range is considered 20Hz to 20kHz, but only the largest loudspeakers can approach 20Hz and even some very large speakers will not be "flat" at 20Hz. Many subwoofers cannot reproduce 20Hz at the same sound pressure level as they reproduce 50Hz. One should recognize that since these measurements are performed in anechoic chamber, they will generally show less bass than what you can expect in a real room.

    Although all frequency response measurements will have some bumps, in general, good speakers will have a smooth and even response within its bandwidth without many severe dips or bumps. Dips indicated less output at that frequency while bumps indicate more. The audible result of the dips and bumps in the response curve will depend on the frequencies where they occur. A bump in the upper bass may make the speaker sound boomy. A dip in the midrange can make the speaker sound recessed

  • Off-axis frequency response (15 degrees) - Measured horizontally at 15 degrees off-axis from the loudspeaker face (2 or 3 meters).

    Purpose: Measures output of loudspeaker at 15 degrees from the center position across the audible frequency spectrum. This mimics the sound that you would get at your listening position with the speakers toed-in somewhat, but not directly aimed at your ears.  

    What it tells you: Ideally this should be very close to the on-axis response, although it will likely vary downward, particularly at higher frequencies. Speakers that have off-axis frequency response that matches the on-axis response are said to have good dispersion characteristics.

  • Off-axis frequency response (30 degrees): Measured horizontally at 30 degrees off-axis from the loudspeaker face (2 or 3 meters).

    Purpose: Measures output of loudspeaker at 30 degrees from the center position across the audible frequency spectrum. This measurement is useful for predicting how strong the early reflections from the side walls of the room will be.  There will likely be more high frequency roll off than the 15-degree off-axis measurement, but the curves should complement each other and not vary radically.

    What it tells you: Like the 15-degree response, this one should ideally be close in shape to the on-axis response. However, this one will likely be lower than the 15-degree response. Like all response measurements one should look examine the bandwidth and the smoothness of the response across that range. If the off-axis response at 30 degrees is very close to the on-axis response the speaker would be considered as having excellent off-axis response.

  • Sensitivity - Averaged response from 300Hz to 3kHz for input signal of 2.83V.

    Purpose: Expresses the output level of the loudspeaker with standard input voltage.

    What it tells you: How much power will be needed to drive the speaker to achieve any given listening level. A sensitivity of  92dB and above is relatively high, so the speakers will require less power for any given listening level, while a sensitivity of 85dB and below is low, which means the speaker will require more amplifier power for the same listening level as the
    more sensitive speaker. Sensitivity does not correlate with speaker quality and should only be used to determine how much amplifier power one will need to drive a speaker to sufficiently loud levels.

Chart 2 - Listening Window

  • Listening window - Averages five frequency response measurements and plots them as a single frequency response. The five frequency response measurements that are averaged for the Listening Window are: on-axis, 15 degrees left and right off-axis, 15 degrees up and down off-axis.

    Purpose: Gives increased perspective of on-axis loudspeaker response in listening position. Takes into account subtle variations of on- and off-axis response on both the horizontal and vertical plans.

    What it tells you: Averaging multiple measurements is important because subtle frequency response changes occur in small increments on- and off-axis, both laterally and vertically. This measurement is especially useful because it allows for small variations in the listening position and ear height and can be a more useful determinant of real-world listening than the standard on-axis measurement. Like any frequency response one should take note of the bandwidth (the upper and lower frequencies the speaker extends to), as well as the smoothness of the response across all frequencies. Dips in response mean a speaker is "less-loud" at that point, while peaks mean it is "louder" (i.e., more sound energy). Depending on the frequency it may result in a more distant or forward quality.

Chart 3 - Total Harmonic Distortion + Noise (THD + N)

  • THD+N variation with frequency at 90dB - Measured at 2 meters (equivalent to 96dB at 1 meter) from 50Hz to 10kHz. The top curve of the chart shows the frequency response of the loudspeaker at the determined SPL level (i.e., 90dB) while the bottom curve shows the distortion component of the signal (values below 40dB should be ignored because they are too close to the noise floor of the test equipment to be of use).

    Both curves are reported in dB which can be read off the vertical axis. In order to convert to a percentage one must read the top line (frequency response) and then determine the dB difference between that line and the bottom line (THD+N line). Translation from dB to % is as follows:

    Equal (or 0dB difference) = 100 %
    -10dB = 31.6%
    -20dB = 10.0%
    -30dB = 3.16%
    -40dB = 1.0%
    -50dB = <0.5%

    Please note: an SPL level of 90dB measured anechoically is very loud and considered far beyond normal listening levels, particularly for small loudspeakers. To give more information for real-world listening levels, if it appears that the speaker is being strained beyond its output abilities at this level we will provide a second measurement at at lower SPL (the SPL level will be printed with the chart).

    Purpose: Measures THD+N output at discrete frequency intervals for above-normal listening levels. Please note that 90dB output at a 2-meter distance is equivalent to an SPL level of 96dB at a 1-meter distance.

    What it tells you: Audibility of distortion varies as to type of distortion and also the frequency at which it is occurring. Distortion measurements for loudspeakers are usually many times that of electronics (i.e., amplifiers, receivers, etc.). Furthermore, certain types of distortions are more audible than others and the audibility of that also depends on the frequency. Our distortion measurements give a general indication of how much distortion is occurring for a given output level at above normal listening levels. Distortion levels will be less (sometimes much less if the speaker is being stressed beyond capabilities at 90dB) at lower SPLs.

Chart 4 - Deviation from Linearity

  • Deviation from linearity - Measured with a frequency sweep across the audible spectrum on axis at 2 meters.

    Purpose: Shows how a speaker is stressed and if it compresses at certain frequencies as the sound-pressure level is increased.

    What it tells you:  As volume increases, all frequencies should rise at the same rate. However, as a speaker is stressed, compression will occur at certain frequencies. The stress may be mechanical, thermal or otherwise. This test shows those frequencies at which deviation occurs as a result of compression. Many speakers show slight deviations at 90dB. Most speakers start to show serious deviations at 95dB. Very few speakers can be tested at 100dB without damage.

    Please note: We began producing this measurement in early 2006. Before that time, Chart 4 was for Impedance Magnitude Variation With Frequency.

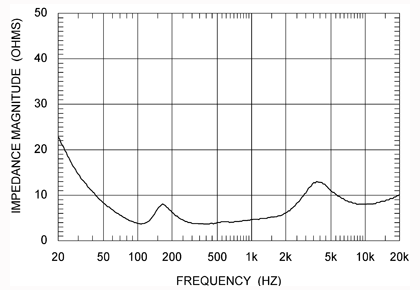
Chart 5 - Impedance Magnitude Variation with Frequency

  • Impedance magnitude variation with frequency - Measured across audible frequency spectrum.

    Purpose: Measures impedance at discrete frequency intervals to indicate load placed on amplifier to drive the loudspeaker.

    What it tells you: In general, the lower the impedance is the harder it will be for the amplifier to supply enough power to properly drive the loudspeaker. The larger the peaks are in the impedance chart, the more difficult the loudspeaker load is and the more control the amplifier will need to have over the loudspeaker to get good optimum sound. The easier the loudspeaker load, the flatter the impedance plot will be and the closer to 8 ohms it will stay. There is no one thing in the impedance curve that tells the entire story of how difficult the loudspeaker load will be, however, in general, there are a couple things to look at including: 1) The minimum impedance levels (in particular, take note of frequencies below 200Hz which many consider harder to drive than the same impedance at higher frequencies), and the size of the narrow peaks in impedance.

    Many stereo and A/V receivers have the smallest power supplies on a watt-per-channel basis so they tend to perform best when connected to loudspeakers which do not go below 6 ohms and do not have large prominent impedance spikes. Many tube amplifiers also benefit from avoiding loudspeakers with large impedance peaks. Occasionally there may be speakers for special applications, like high sensitivity loudspeakers for low powered tube amplifiers where the loudspeaker intentionally has an impedance higher than 8 ohms. This will likely be discussed in those reviews.

    Please note: This measurement was labeled as Chart 4 for sets of measurements produced before early 2006.
我们如何测试喇叭...


勒内圣丹尼斯建立了一个在美国国家研究委员会的电波暗室扬声器。 所有发言者都具有相同的测量设备在同一会议厅,以确保一致和可比的结果。

我们的扬声器测量是由著名的加拿大国家研究理事会。 美国国家研究委员会的设施包括一个现代化的消声室和精密测量设备,以及与这些测试进行几十年的经验的工作人员。 所有的测量是独立于主观评价 - 该审查机构。
总之,我们进行了五个图表显示,让进入下测得的性能评价的角度扬声器共八个试验。
测量距离
所有的小型和中型喇叭的测量,在2米(6.5英尺)的距离。 在适当情况下,较大的扬声器测量从一个3米(9.75英尺)的距离,以便正确的驱动程序集成。

图1 - 频率响应和灵敏度

四次测量就可以看出这个图表:
  • 轴上的频率响应 -测量)直接米,前面的扬声器面(2或3。

    目的: 显示可听频谱向前跨射击输出的扬声器。

    它告诉你: 相较于15度和30度的测量我们做什么,这种测量应该是平坦的,并具有最宽的带宽。 带宽指的是上(高)和较低(低音)扬声器的频率下,测试将重现。 今天大多数优秀的演讲者将很容易延伸到20kHz,超越,虽然低音表现差异巨大。 全范围是20Hz到20kHz的考虑,但只有最大的扬声器可以接近20Hz的,甚至一些非常大的发言不会是“平”在20Hz的。 许多低音炮无法重现20Hz的水平相同的声压在他们重现50赫兹。 人们应该认识到,由于这些测量消声室中进行,他们通常会显示更少的空间低音比你可以指望在真实的。

    尽管所有的频率响应测量会有一些颠簸,在一般情况下,好的演讲者将有一个没有太多严重的凹陷或凸起在其带宽平滑,均匀的响应。 少骤降表示在该频率输出,同时显示更多的颠簸。 对这些坑和撞击声响应曲线的结果将取决于他们在那里发生的频率。 在上一个颠簸可能使低音扬声器的声音boomy。 一个在中档浸可以使扬声器的声音槽

  • 离轴频率响应(15度) -测量水平在15度关闭米)轴由扬声器面(2或3。

    目的: 15度的措施扬声器输出的频谱在中心位置上的声音。 这种模仿声音,你会得到在您的聆听有些位置与喇叭趾,但不是直接针对你的耳朵。  

    它告诉你: 理想情况下这应该是非常接近的轴响应,但它很可能会有所不同频率的下降,特别是在高。 发言者有离轴频率响应相匹配的上轴响应,据说有良好的分散性特点。

  • 离轴频率响应(30度): 在30度测量水平小康米)轴由扬声器面(2或3。

    目的: 30度的措施扬声器输出的频谱在中心位置上的声音。 这种测量方法是有用的预测如何墙强从侧面早期反射的房间会。 有可能会推出更高频测量又比15度离轴,但曲线应相互补充,而不是从根本上改变。

    它告诉你: 像15度的反应,这应该是接近理想形状上的轴响应。 然而,这个反应可能会低于15度。 像所有的人都应该看响应测量的带宽和审查范围,响应平滑度之间。 如果反应在30度离轴非常接近上的轴响应的扬声器将响应视为具有优异的离轴。

  • 敏感性- 平均响应300Hz到3kHz输入2.83V信号。

    目的: 表达了输入电压的输出级标准的扬声器的。

    它告诉你: 如何将需要多大的力量来驱动扬声器实现任何特定的听力水平。 阿九二分贝敏感性及以上相对较高,因此将需要更少的扬声器功率为任何给定的级别听,而八五分贝及以下的敏感性低,这意味着将需要水平,扬声器更放大器的功率相同的听力
    更敏感的扬声器。 不相关的敏感性与扬声器的质量,应该只用来确定有多少人会需要放大器的功率,驱动扬声器足够响亮的水平。

图2 - 倾听窗

  • 听力窗口 -平均数五频率响应频率响应曲线的测量和他们作为一个单一的。 这五个窗口频率响应测量,听力的平均值为有:上轴,15度左,右断轴,向上和向下15度离轴。

    目的: 提供更高的地位,轴扬声器响应听的视角与方法。 考虑到计划帐户和纵向上的微妙变化和水平离轴响应上都。

    它告诉你: 平均多次测量很重要,因为微妙的频率响应变化发生在小的增量和离轴,无论横向和纵向。 这种测量方法是特别有用,因为它允许穗位高的微小变化,在聆听位置,可以是一个与世界测量更加有用的决定因素,真正的聆听,而不是标准的轴上。 像任何一个频率响应应注意的带宽(上下延伸到频率的扬声器),以及平滑的频率响应跨越所有。 平均响应骤降扬声器是“不太响亮”在这一点上,而峰的意思是“响亮”( ,更多声音能量)。 根据不同的频率可能会导致更遥远的或远期的质量。

图3 - 总谐波失真+噪声(THD + N)的

  • THD + N的变异的频率为90dB - )测定2米(相当于1米为96dB从50Hz至10kHz。 图表上方的曲线显示了水平(确定的声压级的扬声器频率响应在 ,为90dB),而底部的曲线显示,信号失真分量(40dB的价值低于应被忽略,因为他们太接近本底噪声测试设备可使用)。

    两条曲线都以dB,可以读出垂直轴。 为了转换为百分比必须阅读上面一行(频率响应),然后决定该行之间和底线(总谐波失真+ N线)分贝的差异。 从翻译到%分贝如下:

    相等(或0dB的差额)= 100%
    - 10dB的= 31.6%
    - 20dB的= 10.0%
    - 30dB的= 3.16%
    - 40dB的= 1.0%
    - 50dB的=“0.5%

    请注意: 一90dB的声压测量水平anechoically很响亮,认为远远超出正常的听力水平的扬声器,特别是小。 为了让更多层次的信息真实世界的听,如果出现喇叭正在紧张超出其输出能力在这个水平,我们将提供第二次测量时以较低的声压级(SPL的水平将印有图表)。

    目的: 措施的THD + N水平输出正常歌曲离散频率间隔以上。 请注意,输出90dB的距离为2米相当于一个声压水平为96dB的距离在1米。

    它告诉你: 可听失真的不同类型,以歪曲,也是它的频率发生。 为喇叭失真测量通常有很多倍,电子产品( ,放大器,接收机等)。 此外,某些类型的扭曲别人更比和所听到的也可听频率取决于。 让我们聆听失真测量水平的一般指示给予多少发生了扭曲的产出水平高于正常。 失真水平将会减少(有时少得多,如果说话的人是在被强调超越能力为90dB),以较低的声压级。

图4 - 线性偏差

  • 偏离线性 - 2米,测得光谱扫描整个可听频率轴上的。

    目的: 演示如何说话人强调,如果它的水平压缩压力在某些频率的声音增加。

    它告诉你:  随着产量的增加,所有的频率应该以同样的速度上升。 但是,作为一个演讲者强调,压缩会发生在某些频率。 可能是机械应力,热或其他方式。 这个测试表明这些频率在发生这样的偏差压缩作为一个结果。 许多发言者在90dB的显示略有偏差。 大多数发言者都开始出现在95dB的严重偏差。 很少扬声器可以在100dB的无损伤检测。

    请注意: 我们在2006年初开始生产这种测量研究。 在此之前,图4是为阻抗震级变异的频率。

图5 - 电阻抗幅值和频率的变化

  • 阻抗随频率的变化幅度 -测得的声音频谱。

    目的: 在离散措施阻抗频率间隔,表示扬声器负载放置放大器来驱动。

    它告诉你: 在一般情况下,阻抗越低越难将用于放大器提供足够的电量进行正常驱动扬声器。 较大的高峰是在阻抗图,更困难的扬声器负载和更多的控制放大器将需要拥有良好的扬声器获得最佳声音。 更简单的扬声器负载,平坦的阻抗情节将和接近8欧姆永远保持下去。 有一件事情没有阻抗曲线中,它告诉整个故事将如何困难的扬声器负载,但是,一般来说,有几件事情来看,包括:1)最低阻抗值(特别注意阻抗频率低于200Hz时的许多人认为难以在更高驱动阻抗比相同频率),并在狭窄的大小山峰。

    许多立体声和A / V接收器具有最小的电源供应器上一瓦,每通道的,所以他们往往表现最好的当连接到扬声器不低于6欧姆去,不要有大的突出阻抗峰值。 许多管放大器也从中受益,避免与大型扬声器阻抗峰。 偶尔也有可能是特殊应用低功率扬声器喜欢那里的扬声器管放大器具有故意高于8欧姆阻抗高灵敏度扬声器。 这很可能会讨论这些审查。

    请注意: 此测量为4打成套图早在2006年之前生产的测量。

分享 转发
TOP
2#

Amphion argon2 Loudspeakers: Measurements
PLEASE NOTE: Our standard is to provide the THD+N measurement at 90dB with a measuring distance of 2 meters (within the anechoic chamber). Since this speaker produced very low distortion levels under those conditions, we have added a second measurement performed at 95dB to give an indication of performance under higher-output conditions.
我们的标准是提供一个测量距离的2米(在消声室)为90dB的THD + N测量。 由于本扬声器在这种条件下生产的低失真水平,我们增加了一个第二次测量时95dB的执行,让下一个更高的产出条件下的性能指标。

Chart 1 - Frequency Response and Sensitivity

Microphone measuring position: midpoint of woofer and tweeter (manufacturer specified)

Frequency response, 20Hz - 20kHz (measured @ 2m, plotted @ 1m)
Loudspeaker sensitivity (averaged 300Hz - 3kHz, 2.83V/1m)

Top curve: on-axis response
Middle curve: 15 degrees off-axis response
Bottom curve: 30 degrees off-axis response
Sensitivity: 85.0dB

Frequency response, 20Hz - 20kHz (measured @ 2m, plotted @ 1m)

Top curve: 45 degrees off-axis response
Middle curve: 60 degrees off-axis response
Bottom curve: 75 degrees off-axis response

Chart 2 - Listening Window

Listening Window, 20Hz - 20kHz (measured @ 2m, plotted @ 1m)

Response curve is an average of five measurements:
on-axis, 15 degrees left and right off-axis,
15 degrees up and down off-axis

Chart 3 - Total Harmonic Distortion + Noise

THD+N @ 90dB, 50Hz - 10kHz (measured @ 2m)

Top curve: frequency response @ 90dB SPL
Bottom curve: THD+N @ 90dB (50Hz - 10kHz)

Additional Measurement
THD+N @ 95dB, 50Hz - 10kHz (measured @ 2m)

Top curve: frequency response @ 95dB SPL
Bottom curve: THD+N @ 95dB (50Hz - 10kHz)

Chart 4 - Impedance Magnitude Variation and Electrical Phase

Impedance curve

Vertical axis: impedance
Horizontal axis: frequency

Electrical phase

Vertical axis: phase
Horizontal axis: frequency

TOP
3#

Amphion Argon3 Loudspeakers:

Chart 1 - Frequency Response and Sensitivity

Microphone measuring position: between tweeter waveguide and mid-woofer

Grille: n/a

Sensitivity: 85.2dB (averaged 300Hz-3kHz, 2.83V/1m)

Frequency response, 20Hz - 20kHz (measured @ 2m, plotted @ 1m)

Top curve: on-axis response
Middle curve: 15 degrees off-axis response
Bottom curve: 30 degrees off-axis response

Frequency response, 20Hz - 20kHz (measured @ 2m, plotted @ 1m)

Top curve: 45 degrees off-axis response
Middle curve: 60 degrees off-axis response
Bottom curve: 75 degrees off-axis response

Chart 2 - Listening Window

Listening Window, 20Hz - 20kHz (measured @ 2m, plotted @ 1m)

Response curve is an average of five measurements:
on-axis, 15 degrees left and right off-axis,
15 degrees up and down off-axis

Chart 3 - Total Harmonic Distortion + Noise

THD+N @ 90dB, 50Hz - 10kHz (measured @ 2m)

Top curve: frequency response @ 90dB SPL
Bottom curve: THD+N @ 90dB (50Hz - 10kHz)

THD+N @ 95dB, 50Hz - 10kHz (measured @ 2m)

Top curve: frequency response @ 95dB SPL
Bottom curve: THD+N @ 95dB (50Hz - 10kHz)

Chart 4 - Deviation from Linearity at 90dB and Above

Difference @ 90dB, 50Hz - 20kHz (measured @ 2m)

Curve: difference from 70dB at 90dB


Curve: difference from 70dB at 95dB

Chart 5 - Impedance Magnitude Variation and Electrical Phase

Impedance curve

Vertical axis: impedance
Horizontal axis: frequency

Electrical phase

Vertical axis: phase
Horizontal axis: frequency

TOP
4#

Amphion Argon3L

Frequency response and sensitivitySensitivity: 85.1dB (averaged 300Hz-3kHz, 2.83V/1m)
Chart A: 20Hz - 20kHz (measured @ 2m, plotted @ 1m)

Top curve: on-axis response
Middle curve: 15 degrees off-axis response
Bottom curve: 30 degrees off-axis response
Chart B: 20Hz - 20kHz (measured @ 2m, plotted @ 1m)

Top curve: 45 degrees off-axis response
Middle curve: 60 degrees off-axis response
Bottom curve: 75 degrees off-axis response
Listening window20Hz - 20kHz (measured @ 2m, plotted @ 1m)

Response curve is an average of five measurements: on-axis, 15 degrees left and right off-axis, 15 degrees up and down off-axis
Total Harmonic Distortion + NoiseChart A: @ 90dB, 50Hz - 10kHz (measured @ 2m)

Top curve: frequency response @ 90dB SPL
Bottom curve: THD+N @ 90dB (50Hz - 10kHz)
Deviation from linearity at 90dB and aboveChart A: Difference @ 90dB from 70dB, 50Hz - 20kHz (measured @ 2m)

Impedance magnitude variation
Vertical axis: impedance
Horizontal axis: frequency
Electrical phase
Vertical axis: phase
Horizontal axis: frequency


TOP
5#

B&W CM1

Chart 1 - Frequency Response and Sensitivity

Microphone measuring position: tweeter axis

Grille: off

Sensitivity: 81.0dB (averaged 300Hz-3kHz, 2.83V/1m)

Frequency response, 20Hz - 20kHz (measured @ 2m, plotted @ 1m)

Top curve: on-axis response
Middle curve: 15 degrees off-axis response
Bottom curve: 30 degrees off-axis response

Frequency response, 20Hz - 20kHz (measured @ 2m, plotted @ 1m)

Top curve: 45 degrees off-axis response
Middle curve: 60 degrees off-axis response
Bottom curve: 75 degrees off-axis response

Chart 2 - Listening Window

Listening Window, 20Hz - 20kHz (measured @ 2m, plotted @ 1m)

Response curve is an average of five measurements:
on-axis, 15 degrees left and right off-axis,
15 degrees up and down off-axis

Chart 3 - Total Harmonic Distortion + Noise

THD+N @ 90dB, 50Hz - 10kHz (measured @ 2m)

Top curve: frequency response @ 90dB SPL
Bottom curve: THD+N @ 90dB (50Hz - 10kHz)

Chart 4 - Deviation from Linearity at 90dB and Above

Difference @ 90dB, 50Hz - 20kHz (measured @ 2m)

Curve: difference from 70dB at 90dB

Chart 5 - Impedance Magnitude Variation and Electrical Phase

Impedance curve

Vertical axis: impedance
Horizontal axis: frequency

Electrical phase

Vertical axis: phase
Horizontal axis: frequency


TOP
6#

B&W DM303 Loudspeakers: Measurements

Chart 1 - Frequency Response and Sensitivity

Frequency response, 20Hz - 20kHz (measured @ 2m, plotted @ 1m)
Loudspeaker sensitivity (averaged 300Hz - 3kHz, 2.83V/1m)

Top curve: on-axis response
Middle curve: 15 degrees off-axis response
Bottom curve: 30 degrees off-axis response
Sensitivity: 88.0dB

Frequency response, 20Hz - 20kHz (measured @ 2m, plotted @ 1m)

Top curve: 45 degrees off-axis response
Middle curve: 60 degrees off-axis response
Bottom curve: 75 degrees off-axis response

Chart 2 - Listening Window

Listening Window, 20Hz - 20kHz (measured @ 2m, plotted @ 1m)

Response curve is an average of five measurements:
on-axis, 15 degrees left and right off-axis,
15 degrees up and down off-axis

Chart 3 - Total Harmonic Distortion + Noise

THD+N @ 90dB, 50Hz - 10kHz (measured @ 2m)

Top curve: frequency response @ 90dB SPL
Bottom curve: THD+N @ 90dB (50Hz - 10kHz)

Additional Measurement
THD+N @ 95dB, 50Hz - 10kHz (measured @ 2m)

Top curve: frequency response @ 95dB SPL
Bottom curve: THD+N @ 95dB (50Hz - 10kHz)

Chart 4 - Impedance Magnitude Variation and Electrical Phase

Impedance curve

Vertical axis: impedance
Horizontal axis: frequency

Electrical phase

Vertical axis: phase
Horizontal axis: frequency

TOP
7#

Definitive Technology Mythos STS SuperTower Loudspeakers:Measurements

Chart 1 - Frequency Response and Sensitivity

Microphone measuring position: tweeter axis

Grille: off

Sensitivity: 89.1dB (averaged 300Hz-3kHz, 2.83V/1m)

Frequency response, 20Hz - 20kHz (measured @ 2m, plotted @ 1m)
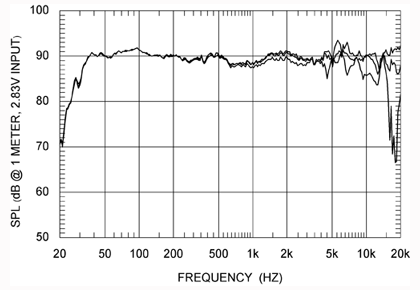
Top curve: on-axis response
Middle curve: 15 degrees off-axis response
Bottom curve: 30 degrees off-axis response

Frequency response, 20Hz - 20kHz (measured @ 2m, plotted @ 1m)
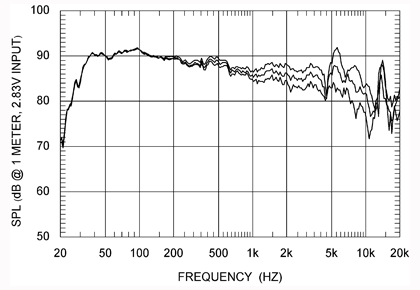
Top curve: 45 degrees off-axis response
Middle curve: 60 degrees off-axis response
Bottom curve: 75 degrees off-axis response

Chart 2 - Listening Window

Listening Window, 20Hz - 20kHz (measured @ 2m, plotted @ 1m)
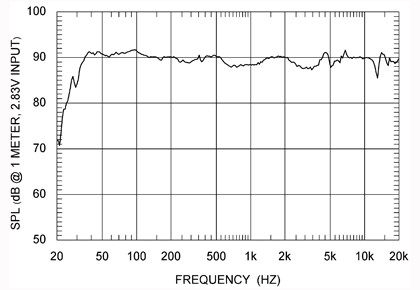
Response curve is an average of five measurements:
on-axis, 15 degrees left and right off-axis,
15 degrees up and down off-axis

Chart 3 - Total Harmonic Distortion + Noise

THD+N @ 90dB, 50Hz - 10kHz (measured @ 2m)
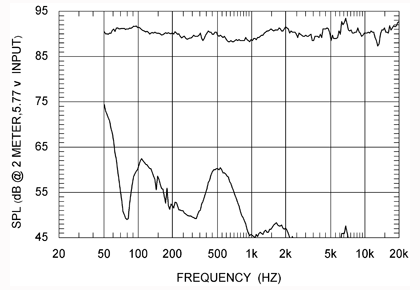
Top curve: frequency response @ 90dB SPL
Bottom curve: THD+N @ 90dB (50Hz - 10kHz)

Additional Measurement
THD+N @ 95dB, 50Hz - 10kHz (measured @ 2m)
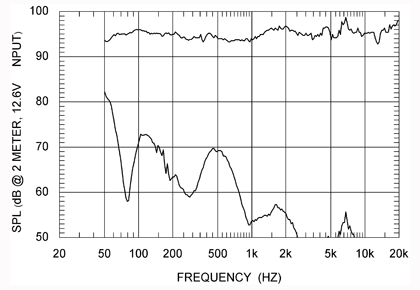
Top curve: frequency response @ 95dB SPL
Bottom curve: THD+N @ 95dB (50Hz - 10kHz)

Chart 4 - Deviation from Linearity at 90dB and Above

Difference @ 90dB, 50Hz - 20kHz (measured @ 2m)
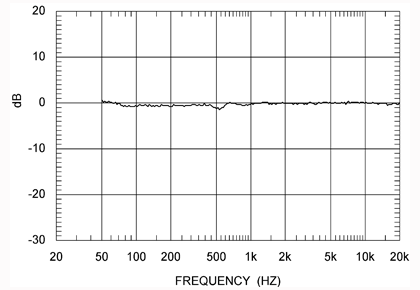
Curve: difference from 70dB at 90dB

Difference @ 95dB, 50Hz - 20kHz (measured @ 2m)
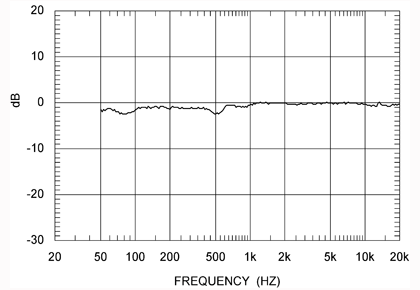
Curve: difference from 70dB at 95dB

Chart 5 - Impedance Magnitude Variation and Electrical Phase

Impedance curve

Vertical axis: impedance
Horizontal axis: frequency

Electrical phase
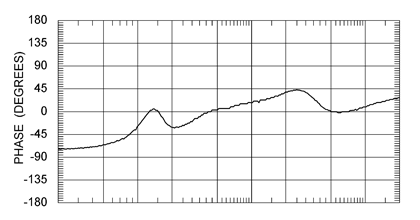
Vertical axis: phase
Horizontal axis: frequency

TOP
8#

Dynaudio Audience 40 Loudspeakers

Chart 1 - Frequency Response and Sensitivity

Frequency response, 20Hz - 20kHz (measured @ 2m, plotted @ 1m)
Loudspeaker sensitivity (averaged 300Hz - 3kHz, 2.83V/1m)

Top curve: on-axis response
Middle curve: 15 degrees off-axis response
Bottom curve: 30 degrees off-axis response
Sensitivity: 85dB

Additional Measurement (with port plug)
Frequency response, 20Hz - 20kHz (measured @ 2m, plotted @ 1m)

Curve: on-axis response

Chart 2 - Listening Window

Listening Window, 20Hz - 20kHz (measured @ 2m, plotted @ 1m)

Response curve is an average of five measurements:
on-axis, 15 degrees left and right off-axis,
15 degrees up and down off-axis

Chart 3 - Total Harmonic Distortion + Noise

THD+N @ 90dB, 50Hz - 10kHz (measured @ 2m)

Top curve: frequency response @ 90dB SPL
Bottom curve: THD+N @ 90dB (50Hz - 10kHz)

Additional Measurement (with port plug)
THD+N @ 90dB, 50Hz - 10kHz (measured @ 2m)

Top curve: frequency response @ 90dB SPL
Bottom curve: THD+N @ 90dB (50Hz - 10kHz)

THD @ 80dB, 50Hz - 10kHz (measured @ 2m)

Top curve: frequency response @ 80dB SPL
Bottom curve: THD+N @ 80dB (50Hz - 10kHz)

Additional Measurement (with port plug)
THD @ 80dB, 50Hz - 10kHz (measured @ 2m)

Top curve: frequency response @ 80dB SPL
Bottom curve: THD+N @ 80dB (50Hz - 10kHz)

Chart 4 - Impedance Magnitude Variation With Frequency

Impedance curve

Vertical axis: impedance
Horizontal axis: frequency

TOP
9#

Dynaudio Audience 80 Loudspeakers: Measurements

Chart 1 - Frequency Response and Sensitivity

Frequency response, 20Hz - 20kHz (measured @ 2m, plotted @ 1m)
Loudspeaker sensitivity (averaged 300Hz - 3kHz, 2.83V/1m)

Top curve: on-axis response
Middle curve: 15 degrees off-axis response
Bottom curve: 30 degrees off-axis response
Sensitivity: 89.0dB

Chart 2 - Listening Window

Listening Window, 20Hz - 20kHz (measured @ 2m, plotted @ 1m)

Response curve is an average of five measurements:
on-axis, 15 degrees left and right off-axis,
15 degrees up and down off-axis

Chart 3 - Total Harmonic Distortion + Noise

THD+N @ 90dB, 50Hz - 10kHz (measured @ 2m)

Top curve: frequency response @ 90dB SPL
Bottom curve: THD+N @ 90dB (50Hz - 10kHz)

Chart 4 - Impedance Magnitude Variation With Frequency

Impedance curve

Vertical axis: impedance
Horizontal axis: frequency

TOP
10#

Dynaudio Confidence C1 Loudspeakers: Measurements

Chart 1 - Frequency Response and Sensitivity

Microphone measuring position: between tweeter and woofer

Grille: off

Sensitivity: 83.5dB (averaged 300Hz-3kHz, 2.83V/1m)

Frequency response, 20Hz - 20kHz (measured @ 2m, plotted @ 1m)

Top curve: on-axis response
Middle curve: 15 degrees off-axis response
Bottom curve: 30 degrees off-axis response

Frequency response, 20Hz - 20kHz (measured @ 2m, plotted @ 1m)

Top curve: 45 degrees off-axis response
Middle curve: 60 degrees off-axis response
Bottom curve: 75 degrees off-axis response

Chart 2 - Listening Window

Listening Window, 20Hz - 20kHz (measured @ 2m, plotted @ 1m)

Response curve is an average of five measurements:
on-axis, 15 degrees left and right off-axis,
15 degrees up and down off-axis

Chart 3 - Total Harmonic Distortion + Noise

THD+N @ 90dB, 50Hz - 10kHz (measured @ 2m)

Top curve: frequency response @ 90dB SPL
Bottom curve: THD+N @ 90dB (50Hz - 10kHz)

Chart 4 - Deviation from Linearity at 90dB and Above

Difference @ 90dB, 50Hz - 20kHz (measured @ 2m)

Curve: difference from 70dB at 90dB

Chart 5 - Impedance Magnitude Variation and Electrical Phase

Impedance curve

Vertical axis: impedance
Horizontal axis: frequency

Electrical phase

Vertical axis: phase
Horizontal axis: frequency

TOP
11#

Dynaudio Confidence C4 Loudspeakers: Measurements

Chart 1 - Frequency Response and Sensitivity

Microphone measuring position: between tweeters

Sensitivity: 88.0dB (averaged 300Hz-3kHz, 2.83V/1m)

Frequency response, 20Hz - 20kHz (measured @ 2m, plotted @ 1m)

Top curve: on-axis response
Middle curve: 15 degrees off-axis response
Bottom curve: 30 degrees off-axis response

Frequency response, 20Hz - 20kHz (measured @ 2m, plotted @ 1m)

Top curve: 45 degrees off-axis response
Middle curve: 60 degrees off-axis response
Bottom curve: 75 degrees off-axis response

Chart 2 - Listening Window

Listening Window, 20Hz - 20kHz (measured @ 2m, plotted @ 1m)

Response curve is an average of five measurements:
on-axis, 15 degrees left and right off-axis,
15 degrees up and down off-axis

Chart 3 - Total Harmonic Distortion + Noise

THD+N @ 90dB, 50Hz - 10kHz (measured @ 2m)

Top curve: frequency response @ 90dB SPL
Bottom curve: THD+N @ 90dB (50Hz - 10kHz)

Additional Measurement
THD+N @ 95dB, 50Hz - 10kHz (measured @ 2m)

Top curve: frequency response @ 95dB SPL
Bottom curve: THD+N @ 95dB (50Hz - 10kHz)

Chart 4 - Impedance Magnitude Variation and Electrical Phase

Impedance curve

Vertical axis: impedance
Horizontal axis: frequency

Electrical phase

Vertical axis: phase
Horizontal axis: frequency

TOP
12#

Dynaudio Excite X12 Loudspeakers: Measurements

Chart 1 - Frequency Response and Sensitivity

Microphone measuring position: tweeter axis

Grille: off

Sensitivity: 82.5dB (averaged 300Hz-3kHz, 2.83V/1m)

Frequency response, 20Hz - 20kHz (measured @ 2m, plotted @ 1m)

Top curve: on-axis response
Middle curve: 15 degrees off-axis response
Bottom curve: 30 degrees off-axis response

Frequency response, 20Hz - 20kHz (measured @ 2m, plotted @ 1m)

Top curve: 45 degrees off-axis response
Middle curve: 60 degrees off-axis response
Bottom curve: 75 degrees off-axis response

Chart 2 - Listening Window

Listening Window, 20Hz - 20kHz (measured @ 2m, plotted @ 1m)

Response curve is an average of five measurements:
on-axis, 15 degrees left and right off-axis,
15 degrees up and down off-axis

Chart 3 - Total Harmonic Distortion + Noise

THD+N @ 90dB, 50Hz - 10kHz (measured @ 2m)

Top curve: frequency response @ 90dB SPL
Bottom curve: THD+N @ 90dB (50Hz - 10kHz)

Chart 4 - Deviation from Linearity at 90dB and Above

Difference @ 90dB, 50Hz - 20kHz (measured @ 2m)

Curve: difference from 70dB at 90dB

Chart 5 - Impedance Magnitude Variation and Electrical Phase

Impedance curve

Vertical axis: impedance
Horizontal axis: frequency

Electrical phase

Vertical axis: phase
Horizontal axis: frequency

TOP
13#

Dynaudio Focus 110 Loudspeakers: Measurements

Chart 1 - Frequency Response and Sensitivity

Microphone measuring position: between tweeter and woofer

Grille: off

Sensitivity: 85.0dB (averaged 300Hz-3kHz, 2.83V/1m)

Frequency response, 20Hz - 20kHz (measured @ 2m, plotted @ 1m)

Top curve: on-axis response
Middle curve: 15 degrees off-axis response
Bottom curve: 30 degrees off-axis response

Frequency response, 20Hz - 20kHz (measured @ 2m, plotted @ 1m)

Top curve: 45 degrees off-axis response
Middle curve: 60 degrees off-axis response
Bottom curve: 75 degrees off-axis response

Chart 2 - Listening Window

Listening Window, 20Hz - 20kHz (measured @ 2m, plotted @ 1m)

Response curve is an average of five measurements:
on-axis, 15 degrees left and right off-axis,
15 degrees up and down off-axis

Chart 3 - Total Harmonic Distortion + Noise

THD+N @ 90dB, 50Hz - 10kHz (measured @ 2m)

Top curve: frequency response @ 90dB SPL
Bottom curve: THD+N @ 90dB (50Hz - 10kHz)

Additional Measurement
THD+N @ 95dB, 50Hz - 10kHz (measured @ 2m)

Top curve: frequency response @ 95dB SPL
Bottom curve: THD+N @ 95dB (50Hz - 10kHz)

Chart 4 - Deviation from Linearity at 90dB and Above

Difference @ 90dB, 50Hz - 20kHz (measured @ 2m)

Curve: difference from 70dB at 90dB

Difference @ 95dB, 50Hz - 20kHz (measured @ 2m)

Curve: difference from 70dB at 95dB

Chart 5 - Impedance Magnitude Variation and Electrical Phase

Impedance curve

Vertical axis: impedance
Horizontal axis: frequency

Electrical phase

Vertical axis: phase
Horizontal axis: frequency

TOP
14#

ocus Audio Prestige FP50

Frequency response and sensitivitySensitivity: 82.5dB (averaged 300Hz-3kHz, 2.83V/1m)
Chart A: 20Hz - 20kHz (measured @ 2m, plotted @ 1m)

Top curve: on-axis response
Middle curve: 15 degrees off-axis response
Bottom curve: 30 degrees off-axis response
Chart B: 20Hz - 20kHz (measured @ 2m, plotted @ 1m)

Top curve: 45 degrees off-axis response
Middle curve: 60 degrees off-axis response
Bottom curve: 75 degrees off-axis response
Listening window20Hz - 20kHz (measured @ 2m, plotted @ 1m)

Response curve is an average of five measurements: on-axis, 15 degrees left and right off-axis, 15 degrees up and down off-axis
Total Harmonic Distortion + Noise@ 90dB, 50Hz - 10kHz (measured @ 2m)

Top curve: frequency response @ 90dB SPL
Bottom curve: THD+N @ 90dB (50Hz - 10kHz)

Deviation from linearity at 90dB and aboveDifference @ 90dB from 70dB, 50Hz - 20kHz (measured @ 2m)

Impedance magnitude variation
Vertical axis: impedance
Horizontal axis: frequency
Electrical phase
Vertical axis: phase
Horizontal axis: frequency


TOP
15#

Focus Audio Signature FS-688 Loudspeakers: Measurements

Chart 1 - Frequency Response and Sensitivity

Microphone measuring position: tweeter, no grille

Sensitivity: 83.0dB (averaged 300Hz-3kHz, 2.83V/1m)

Frequency response, 20Hz - 20kHz (measured @ 2m, plotted @ 1m)

Top curve: on-axis response
Middle curve: 15 degrees off-axis response
Bottom curve: 30 degrees off-axis response

Frequency response, 20Hz - 20kHz (measured @ 2m, plotted @ 1m)

Top curve: 45 degrees off-axis response
Middle curve: 60 degrees off-axis response
Bottom curve: 75 degrees off-axis response

Chart 2 - Listening Window

Listening Window, 20Hz - 20kHz (measured @ 2m, plotted @ 1m)

Response curve is an average of five measurements:
on-axis, 15 degrees left and right off-axis,
15 degrees up and down off-axis

Chart 3 - Total Harmonic Distortion + Noise

THD+N @ 90dB, 50Hz - 10kHz (measured @ 2m)

Top curve: frequency response @ 90dB SPL
Bottom curve: THD+N @ 90dB (50Hz - 10kHz)

Additional Measurement
THD+N @ 95dB, 50Hz - 10kHz (measured @ 2m)

Top curve: frequency response @ 95dB SPL
Bottom curve: THD+N @ 95dB (50Hz - 10kHz)

Chart 4 - Impedance Magnitude Variation and Electrical Phase

Impedance curve

Vertical axis: impedance
Horizontal axis: frequency

Electrical phase

Vertical axis: phase
Horizontal axis: frequency

TOP
16#

Focus Audio Signature FS68SE Loudspeakers:

Chart 1 - Frequency Response and Sensitivity

Microphone measuring position: between tweeter and woofer

Grille: off

Sensitivity: 83.0dB (averaged 300Hz-3kHz, 2.83V/1m)

Frequency response, 20Hz - 20kHz (measured @ 2m, plotted @ 1m)

Top curve: on-axis response
Middle curve: 15 degrees off-axis response
Bottom curve: 30 degrees off-axis response

Frequency response, 20Hz - 20kHz (measured @ 2m, plotted @ 1m)

Top curve: 45 degrees off-axis response
Middle curve: 60 degrees off-axis response
Bottom curve: 75 degrees off-axis response

Chart 2 - Listening Window

Listening Window, 20Hz - 20kHz (measured @ 2m, plotted @ 1m)

Response curve is an average of five measurements:
on-axis, 15 degrees left and right off-axis,
15 degrees up and down off-axis

Chart 3 - Total Harmonic Distortion + Noise

THD+N @ 90dB, 50Hz - 10kHz (measured @ 2m)

Top curve: frequency response @ 90dB SPL
Bottom curve: THD+N @ 90dB (50Hz - 10kHz)

Chart 4 - Impedance Magnitude Variation and Electrical Phase

Impedance curve

Vertical axis: impedance
Horizontal axis: frequency

Electrical phase

Vertical axis: phase
Horizontal axis: frequency

TOP
17#

Leslie兄好貼。
達聲音響極品黑膠唱盤專門店网址:http://www.tatsangaudio.com.cn
TOP
18#

Focus Audio Signature FS-788 Loudspeakers: Measurements

Chart 1 - Frequency Response and Sensitivity

Microphone measuring position: Tweeter axis

Grille: off

Sensitivity: 84.5dB (averaged 300Hz-3kHz, 2.83V/1m)

Frequency response, 20Hz - 20kHz (measured @ 2m, plotted @ 1m)

Top curve: on-axis response
Middle curve: 15 degrees off-axis response
Bottom curve: 30 degrees off-axis response

Frequency response, 20Hz - 20kHz (measured @ 2m, plotted @ 1m)

Top curve: 45 degrees off-axis response
Middle curve: 60 degrees off-axis response
Bottom curve: 75 degrees off-axis response

Chart 2 - Listening Window

Listening Window, 20Hz - 20kHz (measured @ 2m, plotted @ 1m)

Response curve is an average of five measurements:
on-axis, 15 degrees left and right off-axis,
15 degrees up and down off-axis

Chart 3 - Total Harmonic Distortion + Noise

THD+N @ 90dB, 50Hz - 10kHz (measured @ 2m)

Top curve: frequency response @ 90dB SPL
Bottom curve: THD+N @ 90dB (50Hz - 10kHz)

Additional Measurement
THD+N @ 95dB, 50Hz - 10kHz (measured @ 2m)

Top curve: frequency response @ 95dB SPL
Bottom curve: THD+N @ 95dB (50Hz - 10kHz)

Chart 4 - Impedance Magnitude Variation and Electrical Phase

Impedance curve

Vertical axis: impedance
Horizontal axis: frequency

Electrical phase

Vertical axis: phase
Horizontal axis: frequency

TOP
19#

Focus Audio Signature FS-888 Loudspeakers:

Chart 1 - Frequency Response and Sensitivity

Microphone measuring position: between tweeter and top woofer

Grille: off

Sensitivity: 88.5dB (averaged 300Hz-3kHz, 2.83V/1m)

Frequency response, 20Hz - 20kHz (measured @ 2m, plotted @ 1m)

Top curve: on-axis response
Middle curve: 15 degrees off-axis response
Bottom curve: 30 degrees off-axis response

Frequency response, 20Hz - 20kHz (measured @ 2m, plotted @ 1m)

Top curve: 45 degrees off-axis response
Middle curve: 60 degrees off-axis response
Bottom curve: 75 degrees off-axis response

Chart 2 - Listening Window

Listening Window, 20Hz - 20kHz (measured @ 2m, plotted @ 1m)

Response curve is an average of five measurements:
on-axis, 15 degrees left and right off-axis,
15 degrees up and down off-axis

Chart 3 - Total Harmonic Distortion + Noise

THD+N @ 90dB, 50Hz - 10kHz (measured @ 2m)

Top curve: frequency response @ 90dB SPL
Bottom curve: THD+N @ 90dB (50Hz - 10kHz)

Additional Measurement
THD+N @ 95dB, 50Hz - 10kHz (measured @ 2m)

Top curve: frequency response @ 95dB SPL
Bottom curve: THD+N @ 95dB (50Hz - 10kHz)

Chart 4 - Impedance Magnitude Variation and Electrical Phase

Impedance curve

Vertical axis: impedance
Horizontal axis: frequency

Electrical phase

Vertical axis: phase
Horizontal axis: frequency

TOP
20#

Focus Audio Signature FS8 Loudspeakers: Measurements

Chart 1 - Frequency Response and Sensitivity

Microphone measuring position: tweeter axis

Grille: off

Sensitivity: 88.5dB (averaged 300Hz-3kHz, 2.83V/1m)

Frequency response, 20Hz - 20kHz (measured @ 2m, plotted @ 1m)

Top curve: on-axis response
Middle curve: 15 degrees off-axis response
Bottom curve: 30 degrees off-axis response

Frequency response, 20Hz - 20kHz (measured @ 2m, plotted @ 1m)

Top curve: 45 degrees off-axis response
Middle curve: 60 degrees off-axis response
Bottom curve: 75 degrees off-axis response

Chart 2 - Listening Window

Listening Window, 20Hz - 20kHz (measured @ 2m, plotted @ 1m)

Response curve is an average of five measurements:
on-axis, 15 degrees left and right off-axis,
15 degrees up and down off-axis

Chart 3 - Total Harmonic Distortion + Noise

THD+N @ 90dB, 50Hz - 10kHz (measured @ 2m)

Top curve: frequency response @ 90dB SPL
Bottom curve: THD+N @ 90dB (50Hz - 10kHz)

THD+N @ 95dB, 50Hz - 10kHz (measured @ 2m)

Top curve: frequency response @ 95dB SPL
Bottom curve: THD+N @ 95dB (50Hz - 10kHz)

Chart 4 - Deviation from Linearity at 90dB and Above

Difference @ 90dB, 50Hz - 20kHz (measured @ 2m)

Curve: difference from 70dB at 90dB


Curve: difference from 70dB at 95dB

Chart 5 - Impedance Magnitude Variation and Electrical Phase

Impedance curve

Vertical axis: impedance
Horizontal axis: frequency

Electrical phase

Vertical axis: phase
Horizontal axis: frequency

TOP
发新话题 回复该主题